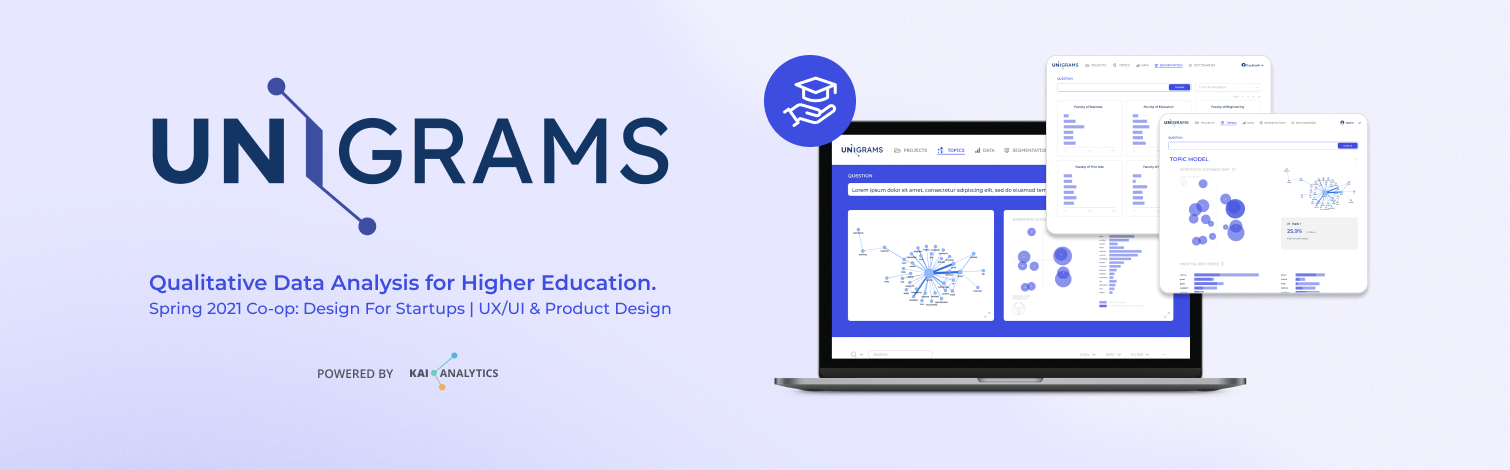
Unigrams
Digital Product Design for Kai Analytics
-
Co-op Period:
January - April 2021
4 months
Project Updates Period:
May - November 2021
7 months
-
Design Research
UX/UI Design
Branding & Identity
Visual Design
Web Design
-
Figma, User Testing
In the spring of 2021, I was accepted into the Design for Startups program with the Shumka Centre for Creative Entrepreneurship at Emily Carr during my last semester of my undergrad. The program pairs emerging designers with early-stage technology startups to work on a specific design problem. Working with Kai Analytics, I designed a qualitative data analysis platform designed to help administrators quickly understand the demands of students, the concerns of staff, and the culture of their higher education institutions. That’s when Unigrams was born — a dashboard to help institutions understand student needs efficiently and on a deeper level.

Research
To understand the users and the scope of the project better, I conducted a brainstorm of an affinity diagram with the team, and mapped out the stakeholders for the platform to clarify our audience. We got to know how these relationships intersect, what they do and how the platform would impact them. Additionally, areas that needed more attention and research, pain points, etc. were brought to light.
Stakeholder Map
In order to contextualize the problem space, personas for the key users were created as a way to empathize with their roles to better understand how they would interact with Unigrams. Key points were blurred to keep the confidentiality of the startup’s business model.

Part of our research included but were not limited to a SWOT analysis; with user interviews done prior to my term working with Unigrams, it gave me more time to analyze and gain more insight on our user pains, gains, and goals.


Design
With research and guidance from leads and stakeholders, I mapped out the user flows for both Unigrams’ web tool and the dashboard to envision exactly how users would interact with our platform from start to finish. We were able to define and pinpoint the user journey with the help of these flows.
After feature development, creating a sitemap, wireflows, and defining our key features, I went ahead and gave our platform a visual design that matched the existing branding while giving it a newer and fresher look, keeping ease of use in mind.
Prototype
Featured below is the dashboard prototype I designed throughout my 4 month co-op term with Unigrams. I showcased the key windows and functions of the platform for qualitative data analysis; Topics, Data, Segmentation, Dictionaries, and Projects. My role in the conceptualization and design of this project continued past my co-op term with account and setting design (unable to display due to limit to public view), and ended with small feature updates to be handed off to a future designer and developers. Overall, I was able to design the previewer and qualitative data analysis dashboard experience for higher education administrators and the overall experience of analyzing student surveys through this platform.
The web design for Unigrams can be found through the link below.